


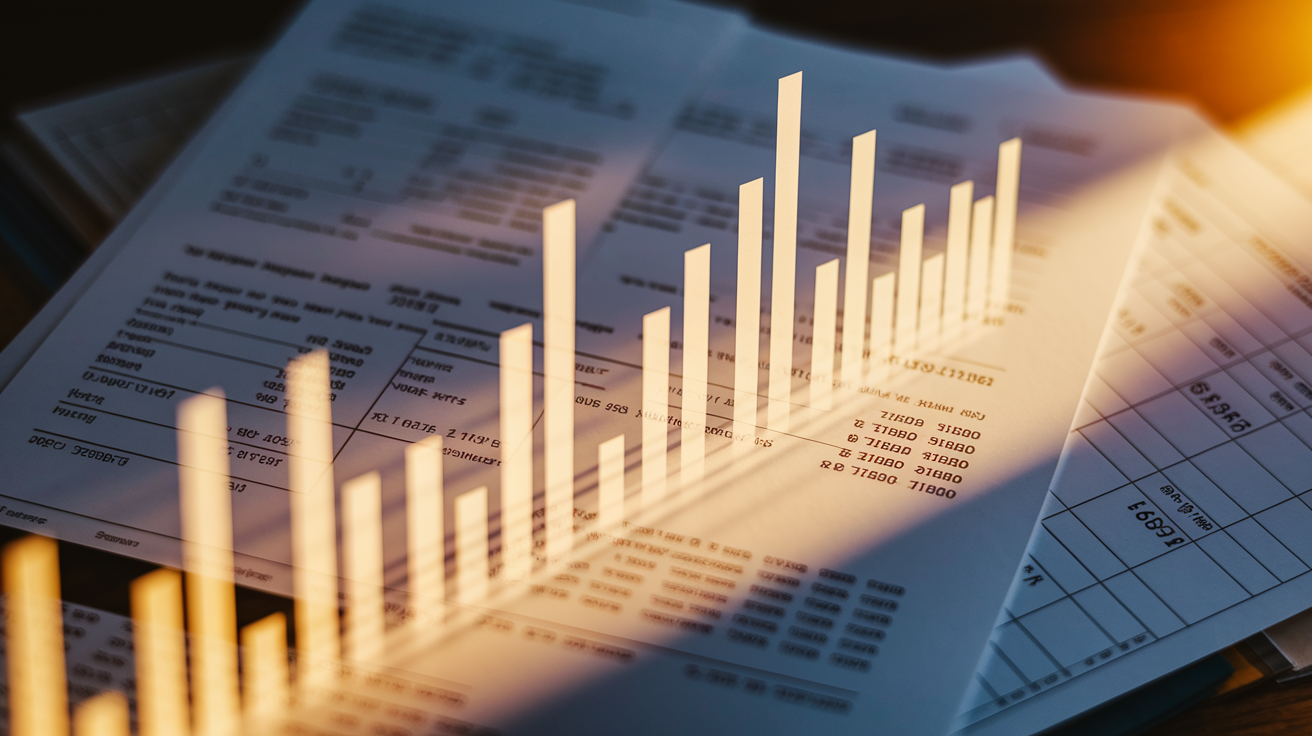
Think your insurer is just raising prices to pad profits? That’s the common story, but it’s incomplete.
Inflation, pricier repairs and medical bills, more frequent storms and thefts, and higher reinsurance and capital costs all push payouts up, and those costs flow into your premium.
This post breaks down the real reasons rates climb each year, shows the common gotchas that cause surprise renewals, and tells you the three things to check before you sign the next policy.
Core Factors Behind Annual Insurance Rate Increases
Insurance rates climb year after year because insurers face relentless upward pressure on the costs they must pay to settle claims and keep their business stable. Inflation is the simplest explanation. When everything from windshields to hospital bills costs more to replace or repair, the money paid out on claims rises proportionally. During 2020–2022, repair materials and labor jumped 10–40 percent, and medical expenses, which already tend to rise 3–6 percent annually, continued to compound. Those increases flow straight into the premium formulas insurers use to ensure they collect enough to cover next year’s claims.
Beyond raw inflation, insurers also pay for the growing frequency and severity of claims. More cars on the road, more distracted drivers, and more complex vehicles that cost more to fix mean more payouts every year. Add in billions of dollars of catastrophe losses from wildfires, hurricanes, and severe storms, and insurers often need 12–36 months to recalibrate their rates to reflect the new baseline risk. That multi-year adjustment period is why a single bad wildfire season or an especially costly storm cluster can push your premium higher long after the headlines fade.
The cost of reinsurance and capital also climbs in stressed market conditions. When reinsurers raise their prices by double-digit percentages after a big loss year, that bill gets baked into your renewal premium. None of these forces operates in isolation. They all compound in the same annual pricing cycle, which is why your bill rarely stays flat and why even a quiet year for claims can still produce a meaningful rate increase.
Economic Pressures Driving Insurance Rate Changes

When insurers earn less on invested premiums, because bond yields are low or equity markets soften, they lean harder on underwriting margins to stay profitable, and that reliance translates directly into higher premiums. In years when returns on reserves drop by even a percentage point, the shortfall runs into billions for large national carriers, and rate filings climb to compensate. Simultaneously, the cost of capital itself can spike during periods of market volatility or after a catastrophe event that burns through surplus, forcing insurers to raise more equity or pay more for debt. Reinsurance renewals, especially after a heavy loss year, can surge by double-digit percentages, and those increases pass through almost dollar for dollar to consumers because reinsurance is a non-negotiable input for managing tail risk.
Economic forces also shape the expense side of the business. Insurers must load premiums to cover claims handling labor, technology infrastructure, regulatory compliance, and fraud detection. All of those costs rise with general CPI and wage inflation. Below are the advanced economic mechanisms that drive structural premium increases even when claim frequency or severity remains flat:
- Investment income shortfall. Lower yields on fixed income reserves force insurers to charge more in premium to achieve the same combined ratio target and return on equity.
- Cost of capital spikes. Periods of market stress or surplus depletion require insurers to raise capital at higher costs, adding basis points to the required underwriting margin.
- Reinsurance pricing cycles. Hard reinsurance markets following large catastrophe years routinely push retail rates up by mid-single to double-digit percentages in the following 12–24 months.
- Expense inflation. Salaries for adjusters, IT spending, legal fees, and regulatory compliance costs all rise in line with or above general CPI, compounding the base expense load.
- Competitive dynamics and risk selection. As some carriers withdraw from high loss regions or tighten underwriting, remaining insurers absorb the riskiest segment of the pool, which forces higher average premiums across the market.
Claims Frequency and Severity Trends Increasing Insurance Costs

Rising claim counts across auto and property lines have forced insurers to pay out more total dollars each year, even before accounting for inflation on individual claims. Between 2020 and 2023, many regions saw a surge in collision frequency, total loss rates, and auto theft. All of which increase the number of payouts per thousand policies. At the same time, each claim costs more to settle due to the specific drivers outlined below. Medical expenses tied to bodily injury claims have been climbing 3–6 percent annually, and liability severity is pushed even higher by expanding jury awards and rising attorney fees in states where litigation on insurance claims is common. In markets where legal system inflation is acute, this can translate to mid-single-digit or even low double-digit annual rate increases that persist year after year.
The combination of higher frequency and higher severity compounds rapidly. Loss ratios, the share of premiums paid out in claims, climb on both axes at once. When an insurer’s loss ratio moves from 65 percent to 72 percent in a single year due to these trends, the pricing model must adjust sharply to restore profitability, and that adjustment appears on your renewal notice. Litigation trends introduce unpredictable severity spikes. A single large verdict in a jurisdiction can reset the settlement baseline for similar claims, driving reserve increases and rate filings across an entire state.
Below is a summary of the specific claim drivers insurers cite most often when filing for rate increases, along with their typical impact on pricing decisions:
| Claim Driver | Impact on Pricing |
|---|---|
| Rising auto repair costs | Parts and labor inflation of 10–40% during 2020–2022 increases average claim severity; advanced vehicle technology raises repair complexity and parts cost. |
| Medical inflation | Bodily injury claims rise 3–6% annually due to medical cost growth; emergency care and surgical costs climb faster than general CPI. |
| Theft frequency | Increased theft of high demand vehicles and parts raises total loss counts and comprehensive claim severity. |
| Litigation trends | Higher attorney fees, larger jury awards, and expanded liability doctrines raise settlement costs and defense expenses, particularly in liability heavy markets. |
Natural Disasters and Climate-Driven Insurance Rate Increases
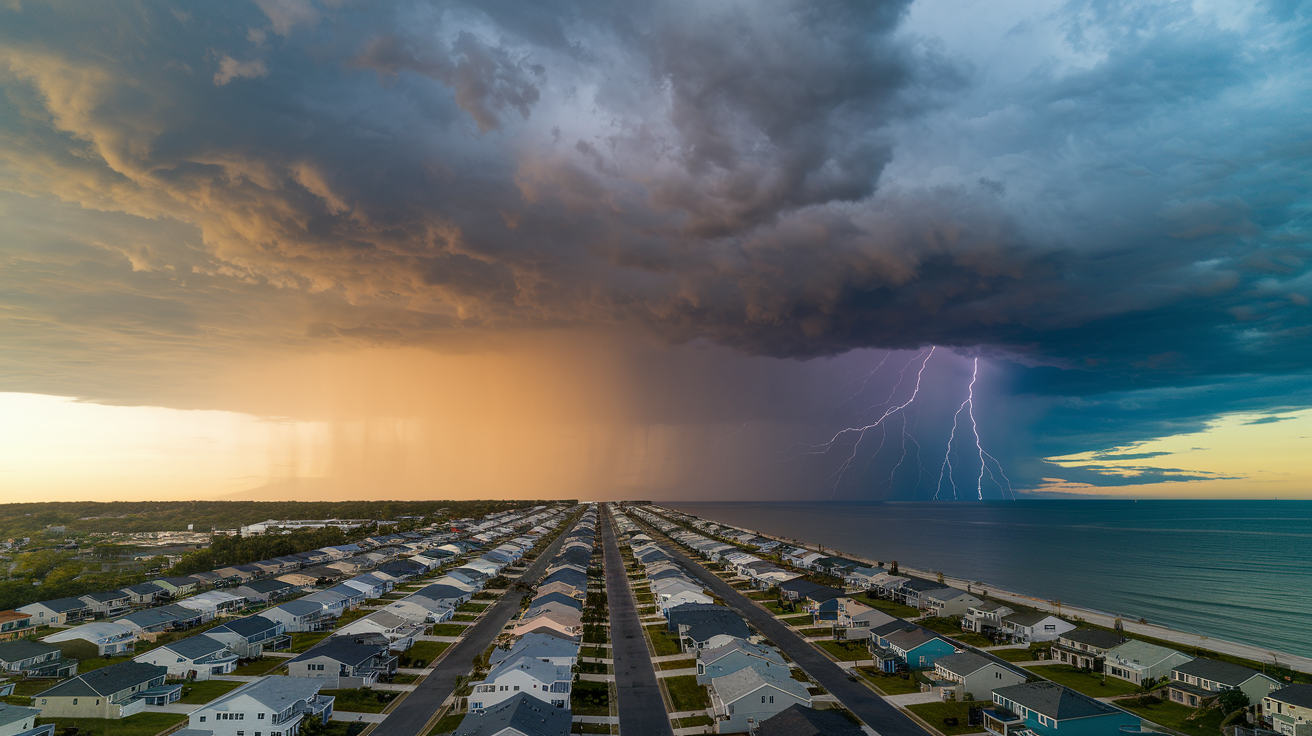
Catastrophe seasons that produce tens of billions in industry losses create pricing pressure that can last two to three years as insurers rebuild capital, reprice risk, and reset reinsurance programs. After a severe wildfire year or an active hurricane season, homeowners and commercial property insurers file for double-digit rate increases in affected regions. Those increases often spread to neighboring states as reinsurers raise pricing across entire territorial bands. Climate driven risk modeling now incorporates the observed increase in both frequency and severity of extreme weather, meaning actuarial assumptions that held for decades have shifted upward, embedding higher baseline rates into the pricing structure even during calm years.
Regional loss concentration amplifies the effect. When a single event destroys thousands of homes in a narrow geographic area, the insurer’s loss ratio in that territory can spike above 100 percent in a single quarter, forcing immediate corrective filings. Catastrophe models, which blend historical loss data with forward looking climate projections, now produce higher probable maximum loss (PML) estimates for many perils. Those elevated PMLs translate directly into higher technical premiums before any profit margin or expense load is added.
Key climate and catastrophe dynamics that drive premium increases include:
- Increasing frequency of billion dollar loss events. More frequent severe weather, wildfires, and flood episodes raise the expected annual aggregate catastrophe loss, which insurers must price into every policy renewal.
- Geographic risk concentration. Development in wildfire prone or coastal flood zones raises insured value density, meaning a single event can produce losses far exceeding historical norms for the region.
- Long tail pattern shifts. Multi-year drought cycles, changing precipitation patterns, and warmer ocean temperatures alter the historical loss distributions insurers relied on, requiring upward revisions to risk models and premiums.
- Reinsurance treaty repricing after catastrophes. After large loss years, reinsurers demand higher rates and reduced coverage limits, forcing primary insurers to retain more risk or pay more for the same protection. Both of which raise consumer premiums.
Reinsurance Market Cycles and Their Effect on Premium Increases
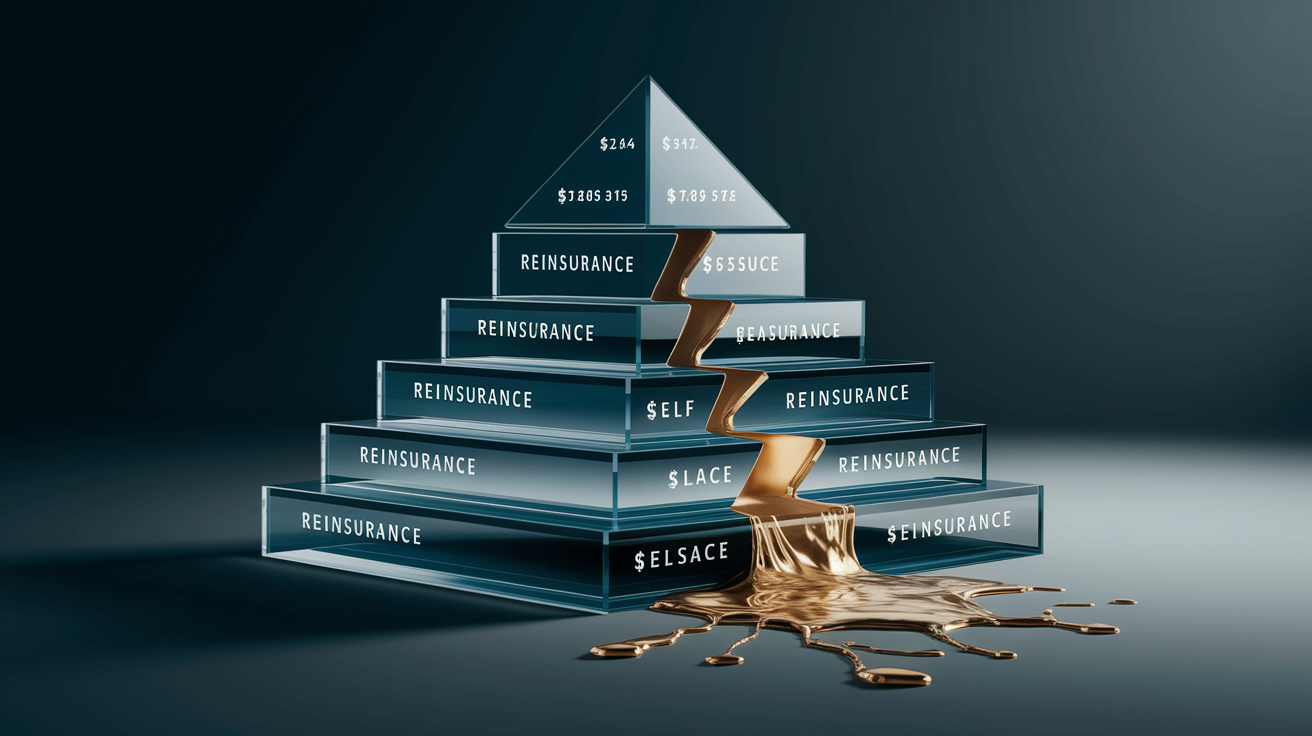
Reinsurance pricing operates in multi-year cycles driven by industry capital levels and recent catastrophe experience, and those cycles exert direct influence on the premiums consumers pay at renewal. After a benign loss year or two, reinsurers compete aggressively for business, lowering rates and offering broader terms. That allows primary insurers to buy cheaper protection and moderate their retail pricing. When a severe catastrophe season burns through reinsurer surplus, the market hardens rapidly. Reinsurance rates can jump by 20 percent or more on a single renewal, coverage becomes more restrictive, and attachment points rise. Primary insurers must either absorb that cost, which erodes profitability, or pass it through to policyholders, which is the more common path.
The cost of capital itself also fluctuates with market conditions. During periods of low interest rates or equity market volatility, the return hurdle for reinsurance capital rises, pushing reinsurance pricing higher even without a recent catastrophe. Because reinsurance is a foundational input, most insurers cannot prudently operate without it for tail risk, these cost increases are non-negotiable and flow through to consumers within the next one to two policy cycles. This transmission mechanism explains why your homeowners premium can spike even if your own property has never filed a claim and your local area had no major losses. You’re paying for the systemic repricing of catastrophe risk across the entire reinsurance tower that protects your insurer’s balance sheet.
Policyholder-Specific Changes That Raise Insurance Rates

Your own behavior and circumstances exert powerful influence over your premium trajectory, often outweighing broad market trends when the two collide. A single at fault accident typically raises your auto rate by 20–50 percent for three to five years, and the surcharge declines only gradually as the event ages off your record. Speeding tickets, reckless driving citations, and DUI convictions all trigger similar or steeper increases. Multiple violations compound the effect in ways that can double or triple your base premium. Adding a teenage driver to your policy is one of the most dramatic individual cost drivers insurers see, because young drivers statistically produce claim frequencies several times higher than middle-aged policyholders, and that risk is priced accordingly.
Coverage and deductible choices also shape your bill year after year. Lowering a homeowners deductible from $2,000 to $500 raises your premium sharply because the insurer now expects to pay more small claims. Raising it from $500 to $1,000 can cut your premium by 10–25 percent depending on the carrier and state. Increasing coverage limits or adding endorsements, earthquake, sewer backup, scheduled personal property, adds incremental premium that compounds at renewal when the underlying cost trends also rise. Even mileage changes matter. Increasing your annual driving by 30 percent moves you into a higher exposure band, which raises your rate, whereas reducing mileage by reporting a work from home change or a shorter commute can lower it.
Credit and insurance score shifts are another common policyholder specific driver. Insurers use a personal insurance score partly derived from credit information, and if your score drops due to late payments, new debt, or credit utilization changes, your premium can climb on the next renewal even if you have a clean claims record. Below are the six most impactful individual factors that cause year over year rate changes for a given policyholder:
- Claims history. Filing a claim raises your rate for three to five years. Severity and fault both matter, and multiple claims within a short window compound the surcharge.
- Traffic violations. Speeding, reckless driving, and license suspensions all trigger premium increases. Serious violations such as DUI can cause rates to double or result in non-renewal.
- Credit score shifts. Declines in your credit based insurance score raise your premium. Correcting errors on your credit report with Equifax or the other bureaus can reverse unfair increases.
- Added drivers. Adding a high risk driver, especially a teenager, significantly increases the policy cost due to higher expected claim frequency.
- Coverage and deductible changes. Raising limits or lowering deductibles increases premium. Conversely, raising deductibles by even a few hundred dollars commonly saves 10–25 percent.
- Mileage and usage changes. Higher annual mileage or switching from pleasure use to commuting raises exposure and premium. Reporting reduced mileage can lower rates on renewal.
Industry and Regulatory Influences on Annual Premium Adjustments
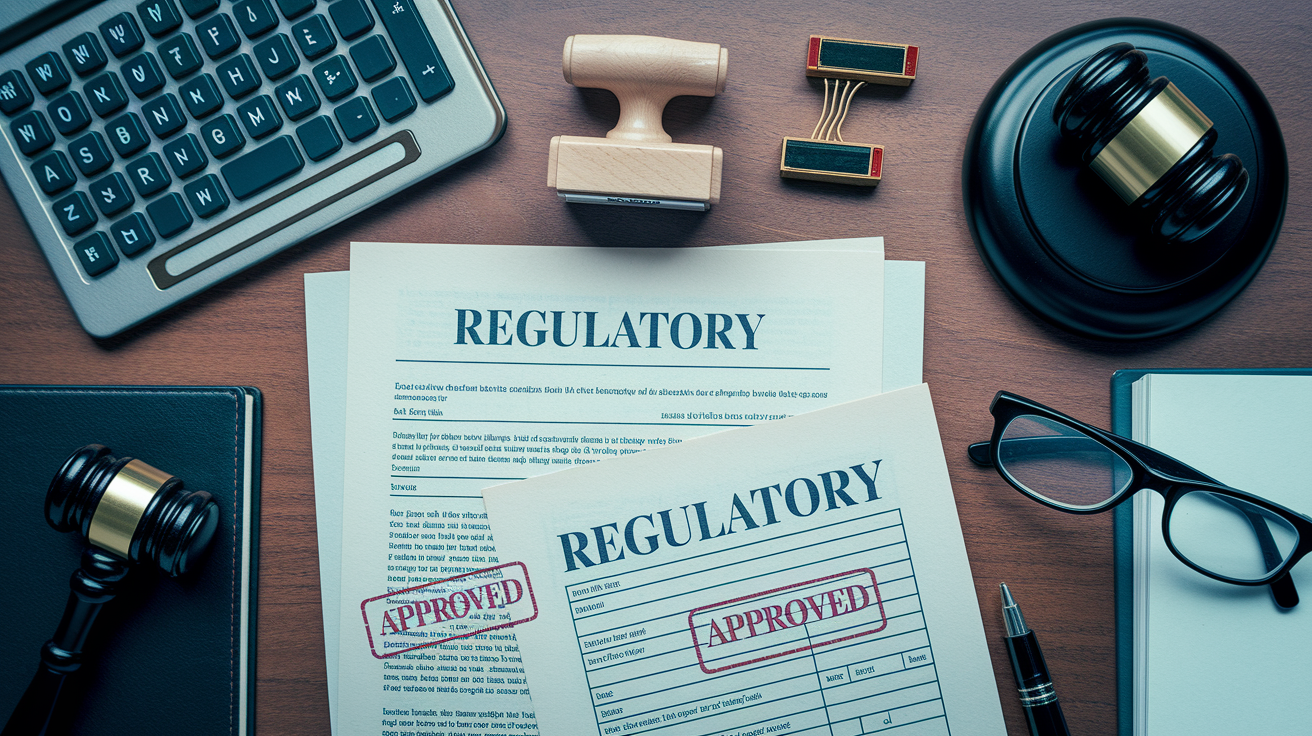
Insurers can’t arbitrarily raise rates whenever they wish. In most states, rate changes must be filed with and approved by state insurance departments, which review actuarial justification and ensure rates are adequate, not excessive, and not unfairly discriminatory. This regulatory process introduces lag into the pricing cycle. When an insurer experiences a sudden spike in claims or catastrophe losses, it can take six to eighteen months for a rate filing to be submitted, reviewed, and approved. That means consumers often see premium increases long after the underlying cost event occurred. Actuarial models predict future losses using historical data, trend factors, and forward looking adjustments, so a major cost shock, such as the 2022 inflation spike or a severe wildfire season, typically affects premiums for 12–36 months as filings cascade through the system and reinsurance programs reset.
Underwriting profitability targets also influence the pace and magnitude of rate changes. Insurers aim for combined ratios, losses plus expenses divided by premium, below 100 percent. When actual ratios exceed targets due to rising claims or reduced investment income, actuaries adjust rate indications upward to restore the target margin. State regulators scrutinize these filings, sometimes denying or reducing requested increases if they deem the supporting data insufficient or the profit margin excessive. In states with strict prior approval regimes, the regulatory review can delay or moderate rate increases, whereas states with file and use or competitive rating laws allow insurers to implement changes more quickly.
The table below summarizes the key regulatory factors that shape how and when your premium adjusts each year:
| Regulatory Factor | Effect on Rates |
|---|---|
| Rate filing and approval process | Introduces lag between cost increases and premium adjustments; regulators may deny or reduce requested increases, slowing or moderating rate changes. |
| Actuarial loss projections | Insurers use historical data and trend factors to predict future claims; upward trends in frequency or severity lead to higher rate indications that feed into filings. |
| Combined ratio and profit targets | When actual combined ratios exceed internal or regulatory benchmarks, insurers file for rate increases to restore underwriting profitability and meet return on equity targets. |
Differences in Why Auto, Home, and Health Insurance Rates Go Up

Auto insurance premiums rise primarily due to the increasing complexity and cost of vehicle repairs, a trend driven by advanced safety technology, embedded sensors, and lightweight materials that require specialized tools and training to fix properly. Repair costs that jumped 10–40 percent during 2020–2022 continue to compound as parts supply chains remain constrained and labor shortages persist in body shops. Theft trends also matter. Vehicles with high demand catalytic converters, key fob vulnerabilities, or popular aftermarket parts face higher comprehensive claim frequency, and those losses feed into territory specific rate increases. A single at fault collision can raise your auto premium by 20–50 percent for several years, making individual driving behavior a large swing factor on top of the systemic cost pressures.
Homeowners insurance is most sensitive to construction and repair cost inflation and to regional catastrophe exposure. Builders face higher lumber prices, labor shortages, and supply chain delays that raise the replacement cost of a destroyed home, and insurers adjust coverage limits and premiums accordingly. Local catastrophe frequency, wildfire seasons, hailstorms, hurricanes, creates multi-year pricing cycles in affected regions, with double-digit rate increases common after severe loss years. Home mitigation measures, such as impact resistant roofing or hurricane straps, can offset some of the increase, but area wide underwriting changes often produce large jumps regardless of individual property characteristics.
Health insurance premium growth is tied to medical cost inflation, which historically runs 3–6 percent annually, and to utilization patterns that shift as populations age or as new treatments become standard of care. Prescription drug prices are a major driver, especially for specialty biologics and brand name medications without generic alternatives. Unlike auto and home insurance, health insurance also faces regulatory and market structure dynamics. Subsidy eligibility, employer contribution changes, and network pricing negotiations, that can produce year over year premium swings unrelated to your own health status. The table below contrasts the primary cost drivers and typical increase magnitudes across the three major insurance lines:
| Insurance Line | Primary Cost Drivers | Typical Increase Range |
|---|---|---|
| Auto | Repair complexity and parts costs; theft frequency; at fault claims (20–50% surcharge); distracted driving and collision frequency. | Single digit increases in stable years; double digit after inflation spikes or regional theft/accident surges. |
| Homeowners | Construction and repair cost inflation; regional catastrophe exposure (wildfire, hurricane, hail); replacement cost increases; reinsurance repricing. | Mid single digit in calm years; often double digit in catastrophe prone regions or after severe loss seasons. |
| Health | Medical care inflation (3–6% annually); utilization trends; prescription drug costs; provider pricing and network changes; regulatory and subsidy shifts. | Mid to high single digits annually; can exceed 10% when employer contributions drop or subsidies change. |
Each line has distinct timeframes for cost transmission. Auto insurers can reprice relatively quickly because policy terms are annual and rate filings are frequent. Homeowners insurers often phase in large increases over multiple renewals to avoid sticker shock, meaning the full impact of a catastrophe year may appear gradually across two or three policy cycles. Health insurers face annual open enrollment windows and multi-year employer contracts, so premium adjustments often lag utilization and drug cost trends by six to twelve months, then arrive as a single large jump rather than smooth incremental changes.
Real Examples and Historical Trends in Premium Increases

The most dramatic recent example of widespread premium surges followed the inflation spike that peaked at 9.1 percent year over year in June 2022. Auto insurers across the country filed for double-digit rate increases in 2022 and 2023 as repair costs, used car values, and rental car expenses all climbed in lockstep. Many states approved increases of 15–25 percent over the span of eighteen months. Homeowners insurers in wildfire prone Western states and hurricane exposed Gulf Coast regions filed similar or steeper increases after catastrophe seasons in 2020 and 2021 produced tens of billions in industry losses. Loss ratio data from those years showed combined ratios well above 100 percent for property lines, forcing actuaries to reset baseline rate levels upward and often to reduce coverage availability in the highest risk zones.
Supply chain disruptions compounded the effect. Semiconductor shortages extended vehicle repair times and raised total loss frequencies, while lumber price volatility made home replacement estimates unstable, leading insurers to build additional margin into their rate filings to account for forecast uncertainty. Health insurers faced a different but parallel dynamic. Deferred care during 2020 led to a utilization surge in 2021 and 2022 as elective procedures resumed. The combination of pent up demand, labor shortages in hospitals, and rising drug costs pushed medical trend factors above historical averages, resulting in premium increases that outpaced general inflation in many individual and small group markets.
Three notable periods stand out in recent history for acute rate increase pressure:
- 2017–2018. Hurricanes Harvey, Irma, and Maria produced combined insured losses exceeding $90 billion, triggering reinsurance market hardening and multi-year homeowners rate increases across coastal and inland wind zones.
- 2020–2022. COVID-19 supply chain disruptions, inflation surge to 9.1 percent, and vehicle/parts shortages drove auto repair costs up 10–40 percent, causing widespread double-digit auto insurance rate filings in 2022 and 2023.
- 2023. Persistent catastrophe activity, severe convective storms, wildfires, and continued elevated repair costs kept property and auto rate filings elevated, with many states seeing sequential annual increases as insurers chased rising loss costs and reinsurance repricing.
How to Limit or Offset Annual Insurance Rate Increases

The single most impactful action you can take is to raise your deductibles if you have the financial cushion to absorb a larger out of pocket expense when a claim occurs. Increasing a homeowners deductible from $500 to $1,000 or from $1,000 to $2,500 commonly reduces your premium by 10–25 percent, and the savings compound every year you avoid a claim. Auto collision and comprehensive deductibles work the same way. Moving from a $250 deductible to $1,000 can cut those coverage premiums significantly, and if you can afford to self insure small fender benders or windshield chips, the cumulative premium savings over a few years often exceed the higher out of pocket cost of a single small claim.
Shopping and comparing quotes every six to twelve months is the second most effective tactic, because insurer pricing varies widely even for identical coverage and risk profiles. Carriers weight rating factors differently. Some penalize credit more heavily, others focus on mileage or vehicle age. The same driver can receive quotes that differ by 30 percent or more. When you shop, request multi-policy discounts by bundling auto and home with a single carrier. These discounts commonly save 5–25 percent across both policies. Also confirm you’re receiving every applicable discount: good student discounts for students with a GPA of B or better, telematics or usage based discounts for safe driving, paperless billing discounts, and safety device credits for home alarms or vehicle anti theft systems.
Small claims discipline is another often overlooked lever. Filing a claim for a minor loss, repairing a $1,200 fender scrape or a $1,500 roof repair, can raise your premium by 20–40 percent for three to five years, meaning the total cost of the surcharge often exceeds the claim payout. If you can afford to pay small repairs out of pocket, doing so preserves your claims free discount and avoids the multi-year rate penalty. For homeowners, documenting and reporting risk mitigation improvements to your insurer can unlock meaningful discounts. Installing impact resistant shingles, hurricane straps, or a monitored alarm system can reduce your premium by single digit to low double-digit percentages depending on the measure and your state.
Six practical strategies to limit or offset rate increases, supported by typical savings ranges:
- Raise deductibles. Increasing your deductible by $500 to $1,000 commonly saves 10–25 percent on the affected coverage; do this only if you have reserves to cover the higher out of pocket expense.
- Bundle policies. Combining auto and home insurance with one carrier unlocks multi-policy discounts of 5–25 percent; compare bundled quotes against separate carrier pricing to confirm savings.
- Shop and compare annually. Request quotes from at least three carriers every year; pricing volatility means the cheapest option today may not be cheapest at renewal.
- Use telematics or usage based programs. Enroll in a monitoring program that tracks mileage and driving behavior to earn discounts and reduce exposure; low mileage drivers can save meaningfully.
- Document home improvements. Report roof upgrades, impact resistant windows, hurricane straps, and monitored alarms to qualify for risk mitigation credits; request written confirmation of discounts applied.
- Practice small claims discipline. Avoid filing claims under $2,000 if you can pay out of pocket; the multi-year surcharge often costs more than the claim payout.
Final Words
We covered the fast causes of yearly premium rises: broad inflation and economic pressure, costlier and more frequent claims, climate losses, reinsurance cycles, and policy-level changes.
You saw how auto, home, and health react differently, viewed historical spikes, and got practical steps to limit increases like raising deductibles, bundling, and shopping annually.
If you still ask why do insurance rates go up every year, start by checking coverages, get written reasons for rate changes, and compare quotes. Do this and you’ll face fewer surprises and more control.
FAQ
Q: Why do insurance companies raise rates every year?
A: Insurance companies raise rates every year because their claim costs (repairs, medical), catastrophe losses, reinsurance and lower investment returns increase, and regulators plus pricing lag force insurers to pass higher costs to policyholders.
Q: Why am I paying $400 a month for car insurance?
A: You are paying $400 a month for car insurance because factors like your driving record, vehicle value and safety features, coverage limits, ZIP code, credit score, and recent claims raise your risk and premium; check coverage and shop quotes.
Q: How much does a $1,000,000 insurance policy cost?
A: A $1,000,000 insurance policy costs vary widely depending on type: a 20‑year term life for a healthy 35‑year‑old might be $25–$80/month, while a $1M umbrella liability often costs $150–$400/year.
Q: Is $3,000 a year for car insurance normal?
A: Paying $3,000 a year for car insurance is high but can be normal depending on your state, coverage levels, driving record, vehicle, and age; shop, raise your deductible, and compare discounts to lower it.
