


Think your insurance will only tick up a few percent every year? Think again.
Recent national figures show auto rates spiked nearly 24% in one year and health marketplace premiums are projected to rise about 26% for 2026.
By contrast, renters and life policies usually creep up 3-8% and 2-5% annually, but state, insurer, and ZIP code can push those numbers much higher.
This post explains what percentage increases to expect by policy type, why rates move, where the common gotchas are, and three checks to do before you renew.
Key Annual Insurance Rate Increase Benchmarks Across Major Policy Types

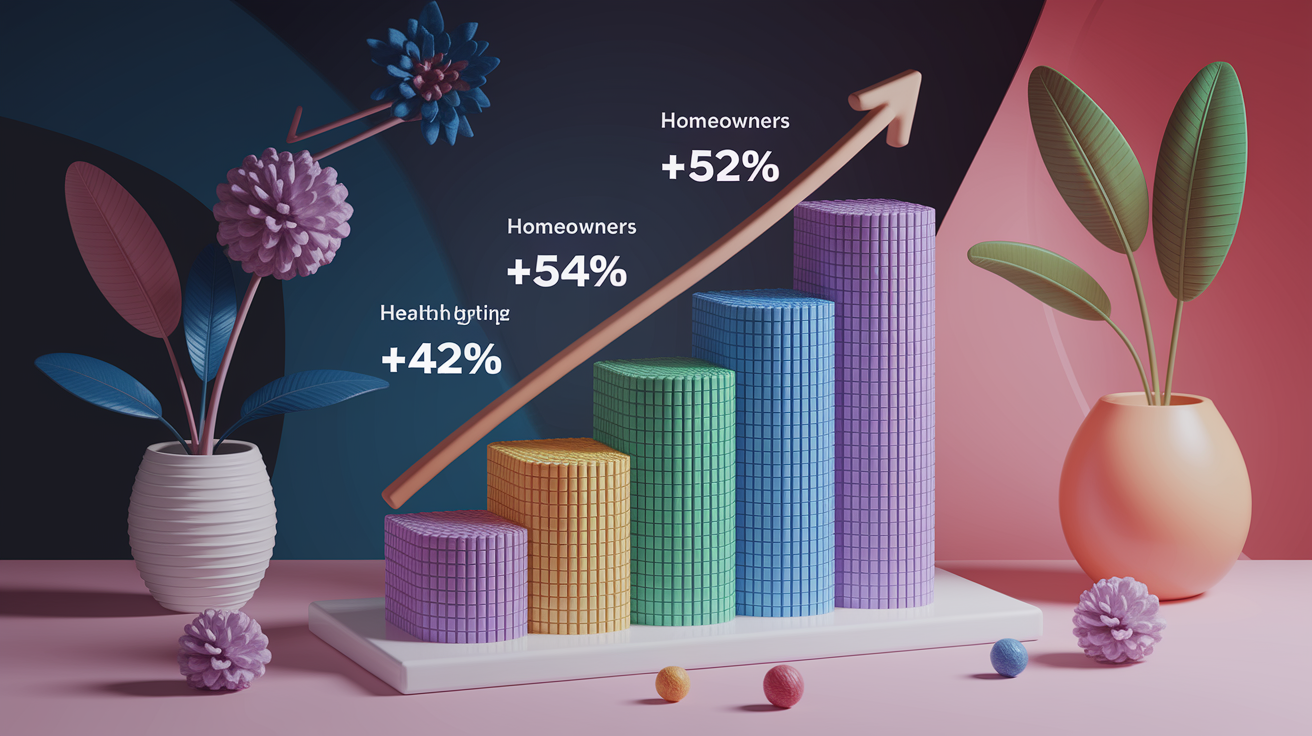
Auto insurance rates jumped nearly 24% year over year in the most recent reported period. That’s the largest single-year increase in at least 20 years and roughly eight times the prior year’s change. Way above the historical 3–4% annual average for car insurance. Home insurance typically rises 5–15% annually, driven by catastrophe losses and replacement cost inflation. Health insurance Marketplace premiums for 2026 are projected to increase 26% on average, with state-run exchanges seeing 17% hikes and Healthcare.gov states facing 30% jumps.
These national averages don’t tell the whole story. One major auto insurer reported a 54% average increase, another 38%, and a third 32%. Regional risk, insurer pricing choices, and what regulators allow all push individual rate changes above or below the headline figures.
Annual increase examples across six insurance types:
- Auto insurance – Historical 3–4% average, recent spike near 24%, insurer-specific increases 32–54%.
- Homeowners insurance – Typical 5–15% annually, higher in catastrophe zones.
- Health insurance (Marketplace) – 2026 projected average 26%, range 17–30% depending on exchange.
- Renters insurance – Smaller increases, typically 3–8% annually, tied to inflation and local claims.
- Life insurance – Modest annual changes, often 2–5%, driven by demographic shifts and investment returns.
- Commercial insurance – Varies widely by sector, recent years 5–20% depending on liability and property risk.
Key Factors Behind Annual Insurance Rate Increases

Inflation is the single largest driver of higher premiums across all policy types. Auto parts prices rose about 50% in one recent year, fueled by supply chain delays and labor shortages. Medical inflation pushes health insurance costs higher through rising hospital prices and expensive new drugs. GLP-1 medications like Ozempic are a cited example. Replacement costs for homes and vehicles climbed 45% over four years, while overall U.S. inflation rose only 15% in the same window. Repair shops, contractors, and medical providers all passed along higher labor and materials costs. Insurers had to raise premiums to match the inflated claims they pay.
Claim frequency and severity both climbed after the pandemic. Traffic fatalities rose about 18%, and accident rates returned to or exceeded pre-pandemic levels as driving resumed. Extreme weather events like hurricanes, wildfires, and severe storms generated billions in catastrophe losses, especially for homeowners insurance. Vehicle thefts topped 1,000,000 in 2022, the highest count since 2009. Litigation and larger jury awards increased the cost of liability claims. Uninsured motorist rates averaged 14% nationally, meaning more collisions involve drivers who can’t pay, shifting costs to insured policyholders through higher premiums.
Five core drivers of annual insurance rate increases:
- Inflation in parts, labor, and medical care – Repair shops, hospitals, and contractors charge more, so insurers pay larger claims and must raise premiums to stay solvent.
- Accident frequency and severity – More crashes and higher cost injuries mean higher payouts. Traffic deaths and injury claims climbed significantly.
- Catastrophe losses – Wildfires, hurricanes, and severe storms generate multi-billion dollar loss years, particularly for home and farm policies.
- Vehicle and property crime – Over 1,000,000 auto thefts in 2022 increased comprehensive claims. Home burglaries and vandalism add cost.
- Litigation and legal costs – Larger settlements and jury awards, especially in liability claims, push insurers to price in higher expected payouts.
Multi‑Year Insurance Rate Trends and Insurer-Level Variations
Auto insurance spent the prior decade averaging 3–4% annual increases, then spiked to nearly 24% in the most recent reported year. That jump reflects a multi-year buildup. Pandemic-era driving patterns masked rising repair costs, and insurers underpriced risk during the slowdown. When traffic returned, loss costs exceeded premiums, forcing aggressive rate filings. Insurer specific increases show how pricing diverged. GEICO raised rates an average of 54%, Allstate 38%, and Farmers 32% in recent filings. Those gaps reflect differences in underwriting results, regional exposure, and regulatory approval timing. Homeowners insurance has climbed steadily in the 5–15% range for years, with catastrophe states seeing the high end of that band. Multi-year compounding means a home policy that started at $1,200 in 2020 could easily exceed $1,800 by 2024 in a high-risk ZIP code, even without a single claim.
Health insurance Marketplace premiums rose 26% on average for 2026, but subsidized enrollees are partially insulated because their payments are capped at a share of household income. Renters insurance has tracked general inflation more closely, typically rising 3–8% per year, with spikes in areas hit by theft or weather losses. Life insurance shows the most stable pattern, with annual changes often in the 2–5% range, driven by gradual demographic shifts, mortality experience, and interest rate impacts on insurer reserves. Multi-year data confirms that property and casualty lines (auto, home) experience more volatility than health or life, because catastrophe and claims cycles swing faster.
| Insurance Type | Multi‑Year Trend Pattern | Notable Insurer‑Specific or High‑End Examples |
|---|---|---|
| Auto | 3–4% average 2010–2022, spike to ~24% recent year | GEICO +54%, Allstate +38%, Farmers +32% |
| Homeowners | 5–15% annually, higher in catastrophe zones | Florida, California, Texas routinely exceed 15% |
| Health (Marketplace) | Variable by year, 2026 projected +26% average | Healthcare.gov states +30%, state exchanges +17% |
| Renters | 3–8% annually, tracks general inflation | Urban high-theft areas see 8–12% |
| Life | 2–5% annually, demographics and interest rates | Term policies more stable; permanent products adjust for investment returns |
Regional and State-Level Differences in Annual Insurance Rate Growth

Geography matters more than almost any other factor. Maryland saw a 55% average annual increase in auto insurance, Washington, D.C. 52%, and Washington state 49% in recent data. Weather risk, dense urban traffic, high theft rates, and aggressive litigation environments all concentrate in certain states, driving premiums far above the national average. On the opposite end, Michigan dropped 18%, Louisiana 17%, and Idaho 11%. Though Michigan and Louisiana still rank among the most expensive states overall, so a decrease from a very high base still leaves premiums elevated. Florida homeowners face relentless increases because of hurricane exposure and a volatile insurance market. California premiums climb on wildfire risk and strict regulatory caps that sometimes force insurers to exit.
State insurance departments vary widely in how they review rate filings. One state processed about 2,600 filings in 2022 and reportedly approved all of them. Another state saw insurers request a 28% average increase, which regulators expected to reduce before final approval. These inconsistencies mean two drivers with identical profiles can pay vastly different premiums depending on their ZIP code and the regulatory stance in their state.
Four examples of highest and lowest state annual changes:
- Maryland auto insurance – +55% average annual increase, driven by urban density, litigation, and theft.
- Washington, D.C. auto insurance – +52%, reflecting high repair costs and claims frequency in a compact metro area.
- Michigan auto insurance – −18%, following reform of unlimited personal injury protection rules, though premiums remain high overall.
- Louisiana auto insurance – −17%, after years of litigation reform and insurer stabilization, but still one of the costliest states.
How Insurers Calculate Annual Premium Increases

Insurers start with actuarial trend factors. They project forward the cost of claims by analyzing recent loss experience, inflation in repair and medical expenses, and changes in accident frequency and severity. If repair costs rose 10% last year and are expected to rise another 8% this year, that 8% feeds directly into the rate calculation. Loss ratios (the percentage of premium paid out in claims) determine profitability. If an insurer paid $1.05 in claims for every $1.00 collected in premium, it lost money and must raise rates to break even. Investment income offsets some underwriting losses, but low interest rates reduce that cushion. Insurers also adjust for shifts in the risk pool. If healthier or safer customers leave, the remaining pool becomes more expensive to insure, so rates rise to match the higher expected claims.
For 2026 health Marketplace filings, insurers reportedly added about 4 percentage points to their rate requests because they anticipated healthier enrollees would drop coverage if enhanced premium tax credits expired. That pricing assumption shows how insurers layer behavior forecasts into annual increases. Regulatory submissions require detailed justification for every trend assumption, but approval varies. One state processed thousands of filings without disapproval. Another routinely reduces large requests, forcing insurers to file again or accept lower increases.
Four key calculation components:
- Trend factor – Projected inflation in claims costs (parts, labor, medical) over the next policy period.
- Risk pool change – Expected shift in policyholder mix. Fewer low-risk customers or more high-risk ones raises the average cost per policy.
- Administrative cost change – Overhead, technology, compliance, and distribution expenses that grow with inflation or regulatory requirements.
- Investment income expectations – Lower bond yields or stock returns reduce the income insurers earn on float, forcing higher premiums to cover claims.
Regulatory Oversight and Its Effect on Annual Rate Increases
Rate filings go to state insurance departments, which review actuarial justification, loss data, and trend assumptions before approving or rejecting the request. The process varies dramatically. One state processed about 2,600 rate filings in 2022 and reportedly didn’t disapprove any, reflecting a marketplace oriented regulatory philosophy that lets competition and consumer shopping discipline pricing. Other states take a more interventionist stance. Insurers in one jurisdiction requested a 28% average increase, which regulators expected to reduce before final approval, forcing companies to revise assumptions or accept a smaller hike. These differences mean identical loss experience can produce a 15% approved increase in one state and a 30% increase in another, simply because of regulatory culture.
The debate centers on whether strict caps protect consumers or push insurers to exit the market. Florida’s experience shows both sides. Regulators capped homeowners rate increases for years, and multiple insurers left the state, reducing competition and leaving fewer, more expensive options. Texas has taken a lighter touch approach, approving most filings and emphasizing consumer shopping as the discipline mechanism. That philosophy shows up in the data (thousands of filings approved with minimal modification) and places the burden on policyholders to compare quotes and switch carriers to dodge steep increases.
How Consumers Can Reduce or Offset Annual Premium Increases

Shop multiple insurers at least every six months, not just at renewal. One carrier raising rates 20% doesn’t mean every carrier is doing the same. Pricing spreads widen during volatility, so aggressive shopping often uncovers a competitor charging 15–30% less for identical coverage. Get quotes from at least three carriers, including one direct writer and one independent agent who can compare multiple companies at once. Timing matters. Request quotes 30–45 days before your renewal date so you have room to switch without a coverage gap.
Adjust your deductible and coverage limits carefully. Raising an auto collision deductible from $500 to $1,000 can cut premium 10–15%, but only if you can afford the higher out-of-pocket cost after an accident. Review whether you still need comprehensive coverage on an older car. If the vehicle is worth less than ten times the annual premium, consider dropping it. For health insurance, switching from a silver plan to a bronze plan can eliminate monthly premiums for lower-income enrollees, but be ready for a deductible jump from under $100 to over $7,000. That trade off works if you rarely use care. It backfires the first time you need surgery or an ER visit.
Bundle policies with one insurer to capture multi-policy discounts, often 10–25% off each line. Defensive driving courses, student good-grade discounts, military or professional association memberships, and low-mileage programs all shave premium. Review your mileage annually. If remote work cut your commute, tell your insurer and request a rate adjustment. Some carriers offer rate stability or accident forgiveness programs. Compare the cost of those endorsements against the potential savings from switching after a small claim.
Five concrete steps to offset annual rate hikes:
- Reshop every six months – Get quotes from at least three insurers. Pricing spreads widen during volatile periods, and switching can save 15–30%.
- Raise deductibles strategically – Increase collision or comprehensive deductibles if you have an emergency fund to cover the higher out-of-pocket. Typical savings 10–15% per increment.
- Bundle policies – Combine auto, home, renters, or umbrella coverage with one carrier to unlock multi-policy discounts of 10–25%.
- Claim selectively – Small claims (under $1,000–$1,500) often cost more in premium increases over three years than paying out of pocket. Run the math before filing.
- Capture all discounts – Defensive driving, low mileage, good student, military, professional association, and paperless billing discounts stack. Ask your agent for a full list and provide documentation.
Final Words
We ran through national benchmarks for auto, home, and health increases, the main drivers pushing premiums up, insurer and state differences, how rates are calculated, and practical ways to fight hikes.
Key takeaways: auto costs spiked recently, health premiums are rising fast in some markets, and local rules or your insurer make a big difference. Fine print matters.
If you still wonder “what percentage do insurance rates increase annually,” use the ranges here, shop multiple quotes, and raise deductibles carefully. You can, and should, reduce surprises.
FAQ
Q: How much does insurance go up each year?
A: Insurance typically goes up each year by a few percent, but it varies by line: historically auto 3–4% (recently spiked ~23.8%), homeowners often 5–15%, and health varies by market and plan.
Q: What is the 80% rule in homeowners insurance and what is the 50% rule in insurance?
A: The 80% rule in homeowners insurance means you should carry at least 80% of replacement cost so claims pay fully. The 50% rule isn’t universal; its meaning varies by policy, state, or code, so check your contract.
Q: How much will insurance premiums go up in 2026?
A: Insurance premiums in 2026 are projected to rise notably: health Marketplace plans average about 26% (roughly 17% in some state marketplaces and ~30% on Healthcare.gov). Auto and home increases will depend on insurer and state.
